
As indicated in our previous post, affordable Air Quality Index (AQI) measurements could help to establish a better view and understanding on what is really happening around you as far as Air Quality. Having a consolidated view and data provided in a consistent way by many sensors, will provide a single source of accurate indication of trends as well as historical data. Different technologies could be used to transmit data to the Cloud, low power and long range being preferred. With increasing penetration of 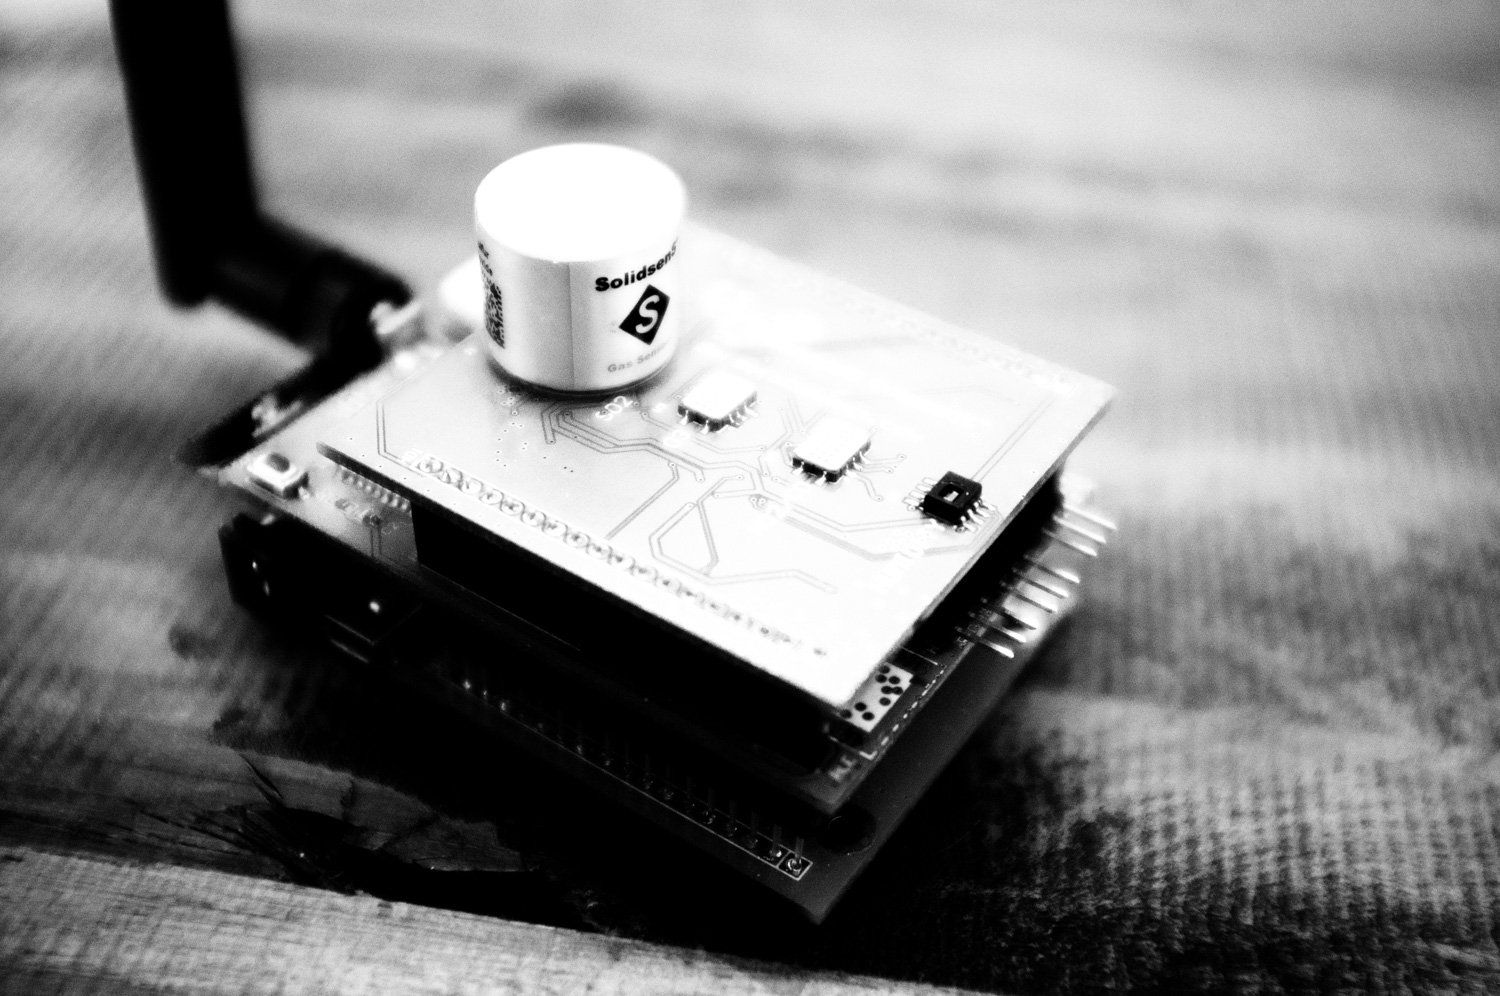 LoRaWan, design of such sensor became feasible. After several long discussions, we have decided to create one. The main objective was a affordability. Virtual everyone should be able to afford it. At the same time, we do not want to “cut any corners” and we decided to measure all relevant parameters necessary to calculate Air Quality Index, just like the local Governments would do.
gases: NO2, SO2, CO and O3
particles condensation at PM2.5 and PM10.
The clean power was our secondary objective. After researching available energy sources, we have decided that solar power combined with good rechargeable battery was the most reliable source of energy for our project.
The prototypes are already collecting data across 3 continents, well still only 3 cities :). The product will be available soon through SensorsConnect web site. The product, collects all necessary variables required to establish Air Quality Index; In addition, temperature, humidity and GPS location are also measured. Collected measurements are sent over LoRaWan, operating in either private or public mode on European or North American bands of LoRaWan. In North American flavour, users can connect via full 64+8 mode gateway or hybrid mode gateway limited to one of the 8 sub-bands configurable via our provisioning interface. Each node will ship factory pre-calibrated and will provide a mechanism to self-calibrate in a clear Air. Configuration of measurement cycle duration, GPS mode of operation and LoRaWan specific parameters is available over LoRaWan and/or BLE (future perhaps). The GPS sensor provides location information and accurate clock for the unit. By default, GPS operates in a Mobile mode, collecting location information as often as a measurement cycle is called. In order to improve  battery life, or simple if your device is mounted permanently at one location, GPS activity can be limited. SenseInAir® (SIA) can be re-configured to operate in a stationary or fixed position mode where only a single GPS lookup is performed in order to establish location and set unit’s internal Real Time Clock. However, having the Mobile GPS mode presents an interesting opportunity for Cities fully covered by LoRaWan. Driving around in an electric car (with the unit on your dash), could generate a virtual map of a region, indication AQI factors for all critical parts of the City. Areas and factories causing higher pollution could be easily identified and monitored.
The node will be ready for expansion. Optional (future) Zigbee interface and matching future firmware releases will accommodate additional sensors and turn it into a smart Zigbee/LoRaWan bridge. We are still contemplating if that makes sense, as it will obviously increase the unit cost. The SenseInAir® is based on STMicroelectronics STM32 series MCU designed for the Ultra-Low power mode of operation. During idle time, MCU and sensors together, consume below 1uA. With our carefully crafted hardware design and power saving algorithms, the SensorsConnect device can operate for a long time on a single battery charge, even when sun is not cooperating. For special cases, where solar charging is not suitable as energy source, the SenseInAir® could utilize a industrial grade Lithium battery strong enough to provide several years of maintenance free operation. As I mentioned before, an optional Bluetooth LE can help with initial provisioning and/or field provisioning of the unit, however full provisioning can also be performed over LoRaWan. Units, can also be ordered with custom configuration or pre-provisioned for one of the existing LoRaWan networks, ready to be plugged in and connect without any configuration. The default profile will connect via The Things Network. Affordable cost should allow ordinary citizens to install those units in their backyards. Cities will be able to install hundreds of units per municipality. Such array of those sensors will provide accurate map indicating changes and trends in air 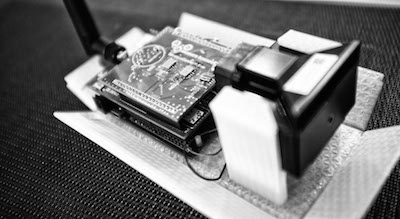 quality and pollution across a City. This information could be valuable for different applications, for instance, cars could be re-directed to alternate roads should the primary roads be over polluted. For areas without LoRaWan coverage BLE could be used to access the data locally from the single node. Additional sensors for SenseInAir® such as inside VOC ( Volatile Organic Compound), CO2 and radiation (alpha, beta and gamma) will be available at later time. The SenseInAir® will be followed by SenseInWater® and SenseInSoil® devices.
Stay tuned, in the next couple of posts, we will present SenseInAir® dashboard and will discuss sensors calibration and methods to obtain accurate data.


 Nokia White Paper, LTE-M